Welcome! Where would you like to log in?

Sign up and get
PRO free for 14 days
Once your PRO trial is over you can continue using Landlord Studio GO completely free.
By continuing you agree to our Terms & Conditions.

Visiting from the
United Kingdom?
Please visit our United Kingdom site for a better experience
Continue
Cash-on-Cash Return vs Cap Rate for Your Rental Property Investment
Should you use cash-on-cash return or cap rate when assessing real estate, and what is a good cap rate for your rental properties?

Read summarized version with:


A good cap rate for a rental property is generally between 5% and 10%, depending on the market and the risk. As a rough guide, 4–6% is typical in stable, low-risk urban markets, 6–8% in mid-tier cities and suburbs, and 8–10%+ in higher-risk or up-and-coming areas. Cap rate is a property's net operating income (NOI) divided by its value; cash-on-cash return measures the pre-tax cash flow against the actual cash you invested.
Key takeaways
- Cap rate measures the unlevered return on a property's value and ignores financing, so it is best for screening and comparing similar properties in a market.
- Cash-on-cash return measures the levered return on the actual cash you invested, so it is best for evaluating a specific financed deal.
- Rule of thumb: use cap rate to screen a deal, and cash-on-cash return to evaluate a financed purchase.
- A good cap rate is broadly 5–10% (4–6% stable, 6–8% mid-tier, 8–10%+ higher risk); a good cash-on-cash return is broadly 8–12%+.
- Both metrics are only as accurate as your net operating income (NOI), so keep clean income and expense records.
Despite there being high demand for single-family homes to rent, simply purchasing a property doesn’t guarantee good returns. In fact, it’s important to reassess any properties you own regularly to ensure they are still good investments. In the case they no longer are, you can start planning an exit strategy as soon as possible and use your assessment to find better investment properties.
Figuring out a property’s potential means doing some rental accounting calculations. There are several main metrics you can use. In this article, we take a closer look at two of them: cash-on-cash return vs cap rate in real estate. Although both calculate return on investment (ROI) based on the financial health of your property, they have distinct purposes. It’s important to know which of them is right for your circumstances, how to use each metric, and the significance of their formulas.
What Is Cap Rate in Real Estate and How Do You Use It
Cap rate in real estate (short for capitalization rate) shows you what profits you can expect to gain from your property as a percentage. It compares either annual returns or potential returns to the market value of your property. A higher percentage means greater projected profitability, but also a greater risk.
The cap rate formula is:
Cap rate = Net operating income (NOI) ÷ market value × 100
(Note: it’s important to use net operating income, not gross income. NOI is your annual rental income minus operating expenses, and it excludes mortgage payments.)
To put this formula into an example, let’s imagine an investor has a property with an NOI of $20,000 and a market value of $200,000. Dividing $20,000 by $200,000 gives 0.10, so the property would have a cap rate of 10 percent. You can run this calculation instantly with our free cap rate calculator, or use our NOI calculator to work out net operating income first.
What Is A Good Cap Rate For A Rental Property?
A good cap rate for a rental property is generally between 5% and 10%, and there is no single “perfect” number because it depends on the market and your risk appetite. A useful tiered guide is: 4–6% in stable, low-risk urban markets; 6–8% in mid-tier cities and suburbs; and 8–10%+ in higher-risk or up-and-coming areas. A higher cap rate usually signals higher potential returns but greater risk, while a lower cap rate often reflects a more stable market with stronger appreciation potential.
For current market comparables, look to published broker research such as the JPMorgan Chase cap rate report, CBRE, or JLL, which report cap rates by property type and city. Always compare cap rates within the same city or neighborhood, since local market dynamics vary widely (a 6% cap rate in a major metro is very different from 6% in a rural area). These tiers match the guidance on our free cap rate calculator.
You may notice some variation in cap rates between different markets. This tends to be due to a few main factors, including the appeal of the location, neighborhood amenities, demand for rental properties, and job opportunities in the area. The formula is excellent for revealing the impact these factors may have on profitability.
Using Cap Rate for Real Estate Investors
As a real estate investor, you may find cap rates useful for evaluating individual properties. However, you’ll still need to determine the reason for differences between properties that seem similar. For instance, the cap rate of one property could be high because the seller wants to offload the property soon. Alternatively, it could be because the property will require a large amount of work before it will be ready to rent.
You may also encounter markets with cap rates that are much lower than average. If properties are appreciating and will likely continue to do so, a cap return of just 3 to 4 percent could still be a good long-term investment.
What Is Cash-on-Cash Return and How to Use It
Cash-on-cash return measures the pre-tax cash a property produces each year relative to the actual cash you invested. Like the cap rate, the value is a percentage, and a higher percentage means a faster return on the money you put in. Unlike cap rate, it accounts for financing.
The correct cash-on-cash return formula is:
Cash-on-cash return = Annual pre-tax cash flow ÷ Total cash invested × 100
Here, annual pre-tax cash flow equals NOI minus annual debt service (your mortgage interest and principal payments), and total cash invested equals your down payment plus closing costs plus any rehab. This is an important distinction: cash-on-cash return is based on cash flow after debt service, not on NOI alone. The worked leverage examples below show exactly how this plays out once financing is included.
Effects of Leverage in Cash-on-Cash Return
Leverage is what makes cash-on-cash return so useful. By borrowing money, an investor can increase cash-on-cash return — provided the loan rate is less than the unleveraged return.
To understand the impact of leverage, let’s put our example of the $200,000 single-family home with an NOI of $20,000 into two scenarios.
In the first scenario, the investor takes out a loan at 6 percent interest (or $7,200 a year) at 70 percent loan-to-value — this equals $140,000, meaning equity required is $60,000. This puts the cash flow post-debt service (NOI minus yearly interest) at $12,800. The cash-on-cash return, therefore, is:
Cash flow post debt service / equity required × 100
$12,800 / $60,000 = 21%
In the second scenario, the investor takes out a loan at 90 percent loan-to-value (which equals $180,000, meaning equity required is $20,000), and the yearly interest is still 6 percent (which now equals $10,200). This puts the cash flow post debt service at $9,800:
$9,800 / $20,000 × 100 = 49%
The second scenario will yield higher returns, but this investment also has a higher risk. The first scenario meets the minimum requirements for most investors. Notice that in both scenarios the return is driven by cash flow after debt service (NOI minus interest) divided by the actual cash invested — which is exactly what the cash-on-cash formula above describes.
What Is A Good Cash-on-Cash Return?
Most investors target a cash-on-cash return of around 8–12%, with many treating roughly 8% as a floor and 10%+ as strong. It is more investor- and leverage-dependent than cap rate: some investors are satisfied with as little as 8 percent, while others want at least 20 percent, and the right number depends on the deal, the market, and how the purchase is financed. As one Forbes Real Estate Council piece notes, expectations vary widely between investors.
Cap Rate vs Cash-on-Cash Return: What's the Difference?
The core difference is financing: cap rate measures the unlevered return on a property's value and ignores debt, while cash-on-cash return measures the levered return on the cash you actually invested. Use cap rate to screen and compare properties in a market, and use cash-on-cash return to evaluate a specific financed deal. The table below summarizes how the two metrics compare.
- What it measures — Cap rate: the unlevered return on the property's value. Cash-on-cash return: the return on the actual cash you invested.
- Formula — Cap rate: NOI ÷ property value. Cash-on-cash return: annual pre-tax cash flow ÷ total cash invested.
- Accounts for financing? — Cap rate: no. Cash-on-cash return: yes.
- Best used for — Cap rate: comparing and screening similar properties in a market. Cash-on-cash return: evaluating a specific financed deal's cash yield.
- Typical “good” range — Cap rate: ~5–10% (market-dependent). Cash-on-cash return: ~8–12%+ (investor- and leverage-dependent).
- Ignores — Cap rate: debt, appreciation, taxes. Cash-on-cash return: appreciation, principal paydown, taxes.
Which Should You Use — Cash-on-Cash Return vs Cap Rate?
It’s difficult to say which is better: cap rate vs cash-on-cash return. It all depends on what you’re trying to learn about the investment properties you own or are considering purchasing.
Cap rate in real estate allows you to compare similar properties in a market by weighing annual income (or potential income) against market price. It tends to be quite clear if the cap rate of a property is desirable, although you do need to take into account how various factors are influencing the market. The right cash-on-cash return, in contrast, is much more dependent on the investor. Plus, leverage can have a big impact.
To go deeper on each metric, see our guides to cap rate in real estate, cash-on-cash return, and return on investment (ROI).
Related: Free Rental Yield Calculator
Cap Rate vs Cash-on-Cash Return FAQs
What is a good cap rate for a rental property?
A good cap rate for a rental property is generally between 5% and 10%, depending on the market. As a guide, 4–6% is common in stable, low-risk urban markets, 6–8% in mid-tier cities and suburbs, and 8–10%+ in higher-risk or up-and-coming areas. Always compare cap rates within the same market rather than across very different locations.
What is the difference between cap rate and cash-on-cash return?
Cap rate measures the unlevered return on a property's value (NOI divided by value) and ignores financing, so it is best for comparing properties. Cash-on-cash return measures the levered return on the actual cash you invested (annual pre-tax cash flow divided by total cash invested) and does account for financing, so it is best for evaluating a specific financed deal.
How do you calculate cash-on-cash return?
Divide your annual pre-tax cash flow by the total cash you invested, then multiply by 100. Annual pre-tax cash flow is NOI minus annual debt service, and total cash invested is your down payment plus closing costs plus any rehab. For example, $12,800 of cash flow on $60,000 invested is a 21% cash-on-cash return.
What is a good cash-on-cash return?
Most investors target a cash-on-cash return of around 8–12%, treating roughly 8% as a floor and 10%+ as strong. It is more investor- and leverage-dependent than cap rate, so the right target depends on the deal, the market, and how it is financed.
Does cap rate include mortgage payments?
No. Cap rate is based solely on net operating income and property value, so it excludes mortgage payments and financing entirely. That is why cap rate allows an unbiased comparison of properties regardless of how each one is financed.
Is a higher cap rate always better?
No. A higher cap rate can mean higher returns, but it often signals higher risk, such as a less stable market, higher vacancy, or a property that needs work. A lower cap rate can reflect a safer, more stable market with stronger appreciation potential.
Should I use cap rate or cash-on-cash return?
Use cap rate to screen and compare properties on an unlevered basis, then use cash-on-cash return to evaluate how a specific financed deal performs on the cash you actually invest. Most investors use both together rather than relying on one alone.
Cap Rate vs Cash on Cash Return: The Takeaway
Understanding the differences between cash-on-cash return and cap rate is essential for evaluating the financial health of your rental properties. These two metrics offer unique insights: cap rate provides a snapshot of overall property profitability relative to market value, while cash-on-cash return highlights the return on the actual cash you invested, especially when leveraging financing. Generally speaking, it’s not a case of using one or the other; rather, investors should look at leveraging their investment’s financial data to the maximum of their ability.
And this is also where Landlord Studio comes in. Landlord Studio is a property management and accounting software designed to streamline these complex financial tracking tasks, providing tools to track, calculate, and compare key performance indicators.
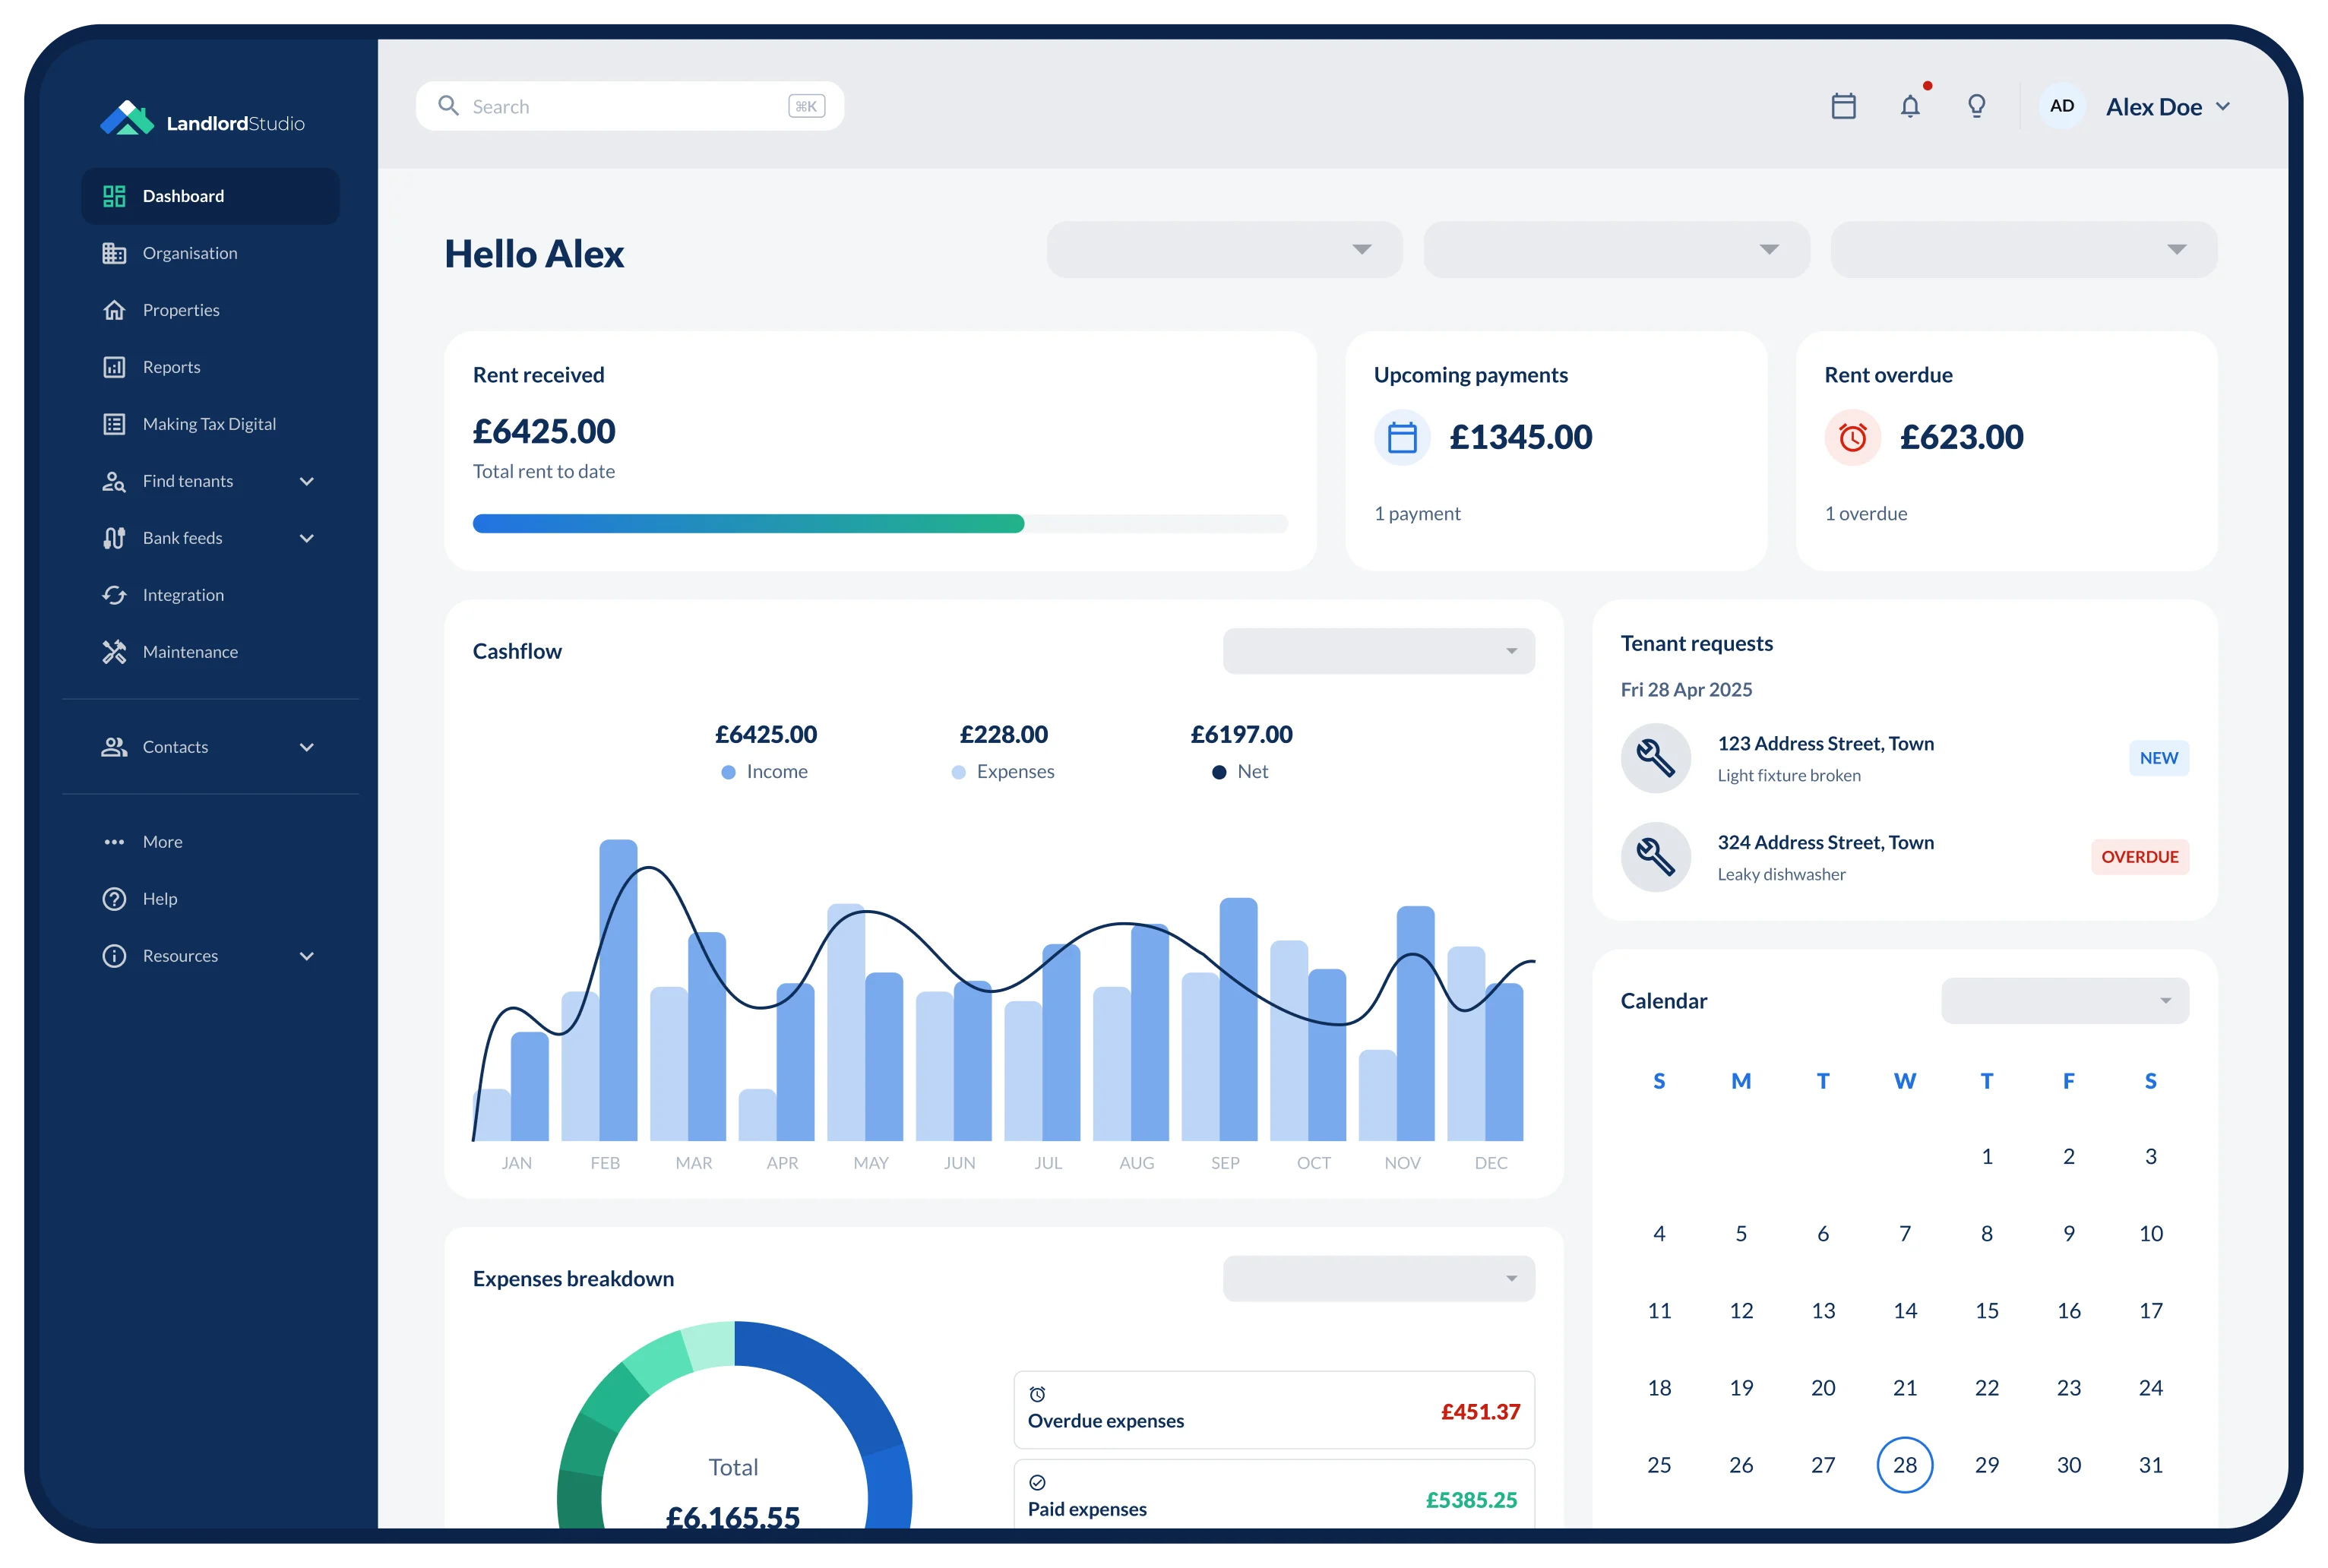
With bank feed integration and smart receipt scanning, Landlord Studio provides fast and simple real-time income and expense tracking along with comprehensive reporting and intuitive dashboards. Meaning you can make data-driven decisions and ensure your investments continue to perform at their best.
Create your free account with Landlord Studio today to find out more.
Related Articles:


About Landlord Studio

Landlord Studio is an easy to use property management and accounting software designed for landlords.
Find and screen tenants, collect rent online, track income and expenses, run reports, and more - all for free.
Create your FREE account with Landlord Studio today.

From finding tenants to filing taxes. Reduce vacancies and maximize your portfolio ROI with software designed for you.
Get started for free